Canada’s July Goods Surplus Contracts as U.S. Exports Decline
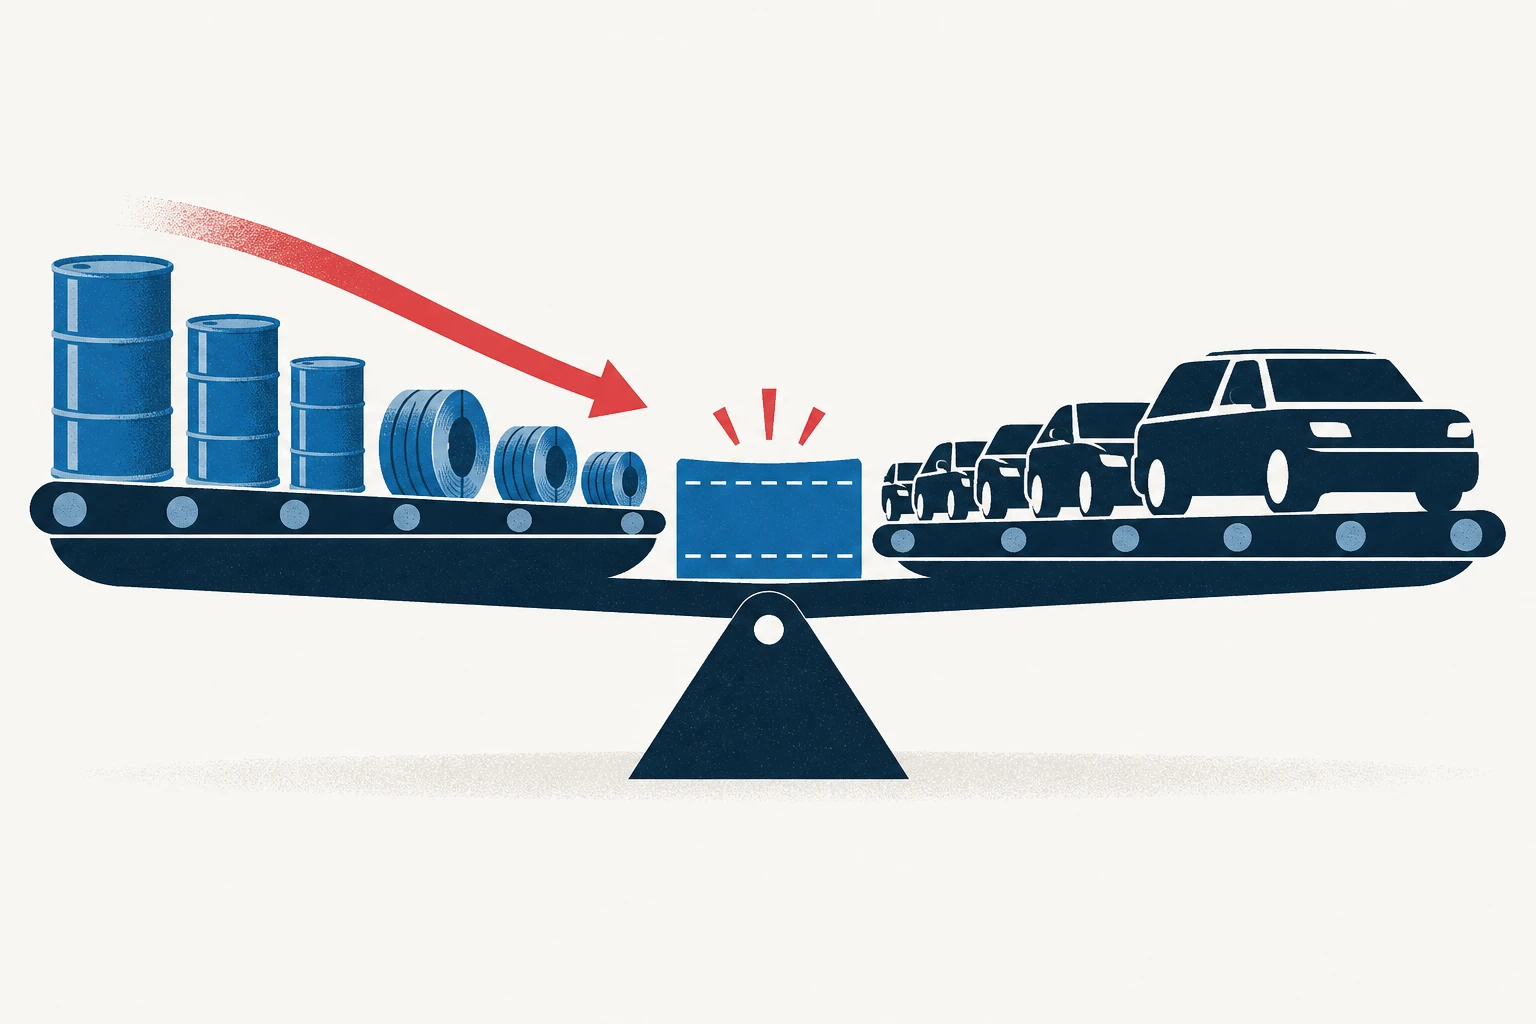
Lower energy and metals shipments cut Canada’s July goods surplus sharply, while record vehicle imports further reduced the bilateral U.S. trade cushion.
Statistics Canada’s July merchandise-trade release showed the global goods surplus narrowing to C$769 million from C$4.2 billion in June. Total exports fell 2.3% to C$76.1 billion after five monthly advances, while imports increased 2.2% to C$75.4 billion, their sixth consecutive monthly gain. Export volumes declined 1.5%, whereas import volumes rose 2.2%. [1]
Energy and metals accounted for much of the export retreat. Exports of metal and non-metallic mineral products decreased 8.5%, following a 15.8% June increase, reflecting lower purchases and prices for unwrought precious metals, including fewer shipments to the United States. Energy exports fell 4.4% for a third month in a row: crude-oil exports were down 5.6% as prices and volumes declined, and natural-gas exports dropped 14.0%. Excluding those two product groups, Canadian exports rose 0.6%. [1]
The U.S. bilateral balance contracted more sharply than the overall figure. Exports to the United States fell 6.6%, the largest percentage decline since April 2025, led by lower crude-oil and gold exports. Imports from the United States rose 1.8%, mainly because of additional passenger-car and light-truck purchases. Canada’s goods surplus with the United States therefore dropped from C$10.3 billion in June to C$5.9 billion in July, the lowest level since February 2026. [1]
Motor vehicles and parts were the largest import-side contributor. Imports in that product group climbed 11.4% to a record high, while seasonally adjusted passenger-car and light-truck imports rose 19.8%. Statistics Canada attributed the increase in part to North American assembly-plant summer shutdowns being less pronounced than usual, especially in the United States. The release reports monthly flows and does not identify a change in tariff treatment as the cause of the automotive increase. [1]
Exports outside the U.S. market moved in the opposite direction, increasing 7.4% to a record C$25.6 billion for a third consecutive monthly rise. Higher shipments to the Netherlands, China and Germany supported that gain, including iron ore, nuclear fuel, crude oil and copper ores. Farm, fishing and intermediate food exports also rose 5.5%, with canola exports up 43.2% on stronger shipments to China, Pakistan and Japan. [1]
Imports from countries other than the United States increased 2.8%, and Canada’s trade deficit with those markets narrowed from C$6.1 billion to C$5.1 billion, the smallest since January 2021. The July results provide a timely indicator of cross-border exposure, but they chiefly reflect commodity prices, volumes and seasonal production patterns. They do not, by themselves, demonstrate a new trade-policy effect or materially alter the dashboard’s industry forecasts. [1]
The official data show a material but bounded monthly deterioration in Canada’s U.S. trade balance, concentrated in energy, metals and vehicles, without a new policy or lasting change in trade conditions [1].